Setting up projects & SDKs for Sentry self-hosted
 • 3 min read • 3/18/2022
This blog is the 5th post in the Sentry self-hosted series. In this article, we will be going through the process of creating a project with Sentry to track and monitor performance and errors. This post will assume you already went over the previous posts in the series to set up Sentry.
Creating a project
The first thing you need to do is create a project on sentry. To do that head to your Sentry self-hosted domain and click on the projects in the side menu: 
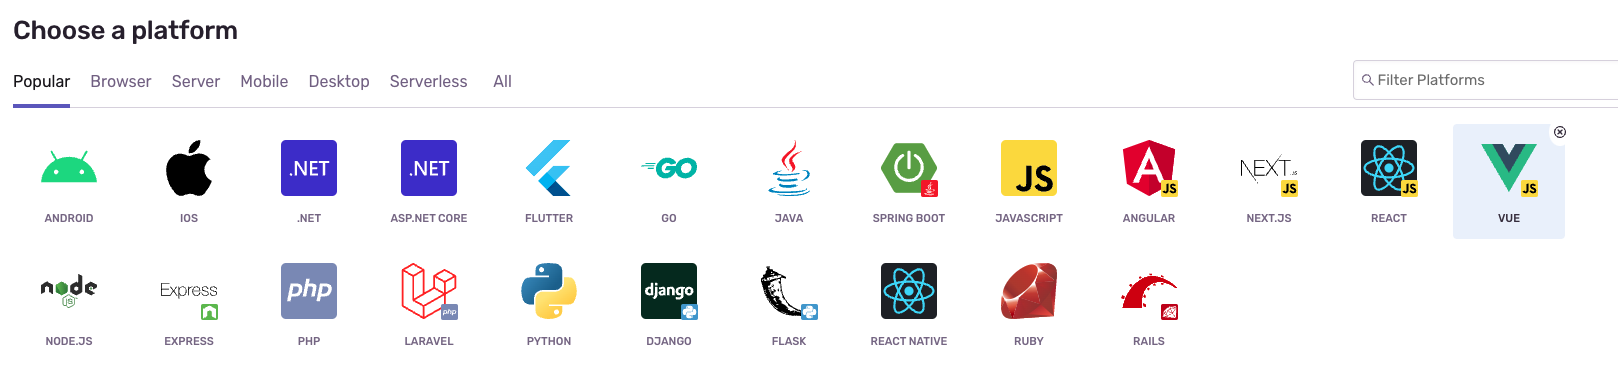
Choose the needed SDK from the list of platforms
Add a project name and select the team (you can also create a new team)
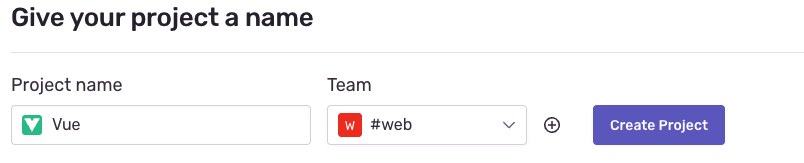
Click on create project.
After creating, it will redirect you to a setup page where they have a tutorial on how to set it up. Follow the instructions and you should be good to go
I will setup Vue.js as an example, others should be similar (but platform specific):
Example Vue Configuration
Installing dependency
# Using yarn
yarn add @sentry/vue @sentry/tracing

# Using npm
npm install --save @sentry/vue @sentry/tracing
Configuration
For Vue 2
import Vue from "vue";
import Router from "vue-router";
import * as Sentry from "@sentry/vue";
import { BrowserTracing } from "@sentry/tracing";

Vue.use(Router);

const router = new Router({
  // ...
});

Sentry.init({
  Vue,
  dsn: "dsn_to_your_instance",
  integrations: [
    new BrowserTracing({
      routingInstrumentation: Sentry.vueRouterInstrumentation(router),
      tracingOrigins: ["localhost", "my-site-url.com", /^\//],
    }),
  ],
  // Set tracesSampleRate to 1.0 to capture 100%
  // of transactions for performance monitoring.
  // We recommend adjusting this value in production
  tracesSampleRate: 1.0,
});

// ...

new Vue({
  router,
  render: h => h(App),
}).$mount("#app");
For Vue 3
import { createApp } from "vue";
import { createRouter } from "vue-router";
import * as Sentry from "@sentry/vue";
import { BrowserTracing } from "@sentry/tracing";

const app = createApp({
  // ...
});
const router = createRouter({
  // ...
});

Sentry.init({
  app,
  dsn: "dsn_to_your_instance",
  integrations: [
    new BrowserTracing({
      routingInstrumentation: Sentry.vueRouterInstrumentation(router),
      tracingOrigins: ["localhost", "my-site-url.com", /^\//],
    }),
  ],
  // Set tracesSampleRate to 1.0 to capture 100%
  // of transactions for performance monitoring.
  // We recommend adjusting this value in production
  tracesSampleRate: 1.0,
});

app.use(router);
app.mount("#app");
A few things to note that must be changed:
- dsn: can be found in the project settings
- tracingOrigins: the URLs you will be reporting from
- tracesSampleRate: For development purposes you can keep it at 1.0. For production it is better to decrease this to 0.1 (meaning 10% of your user’s will report performance analytics)
After changing the above fields, your Sentry SDK should start sending usage analytics back to your Sentry self-hosted instance. (it might take a few mins for data to start appearing).
As usual, if you have any questions don’t hesitate to DM me or ask it in the comments.
Good Luck!
Originally published at theappsguy.dev